Test code through walking a graph
'or: How I learned to walk a graph'
It is possible to model a component as a directed graph, showing the components states and the events to transition those states. Giving us a separate explanation of the behaviour of the component to the implementation of it.
This post is about how we can use that graph to test that an implementation of a component matches the desired behaviour, by walking the graph.
We will look at how to use XState and state charts to derive a directed graph.
Look at the the graph for a component.
How to walk the graph using Testing Library
Finally explore some of the ideas and potential that’s been covered.
A state chart
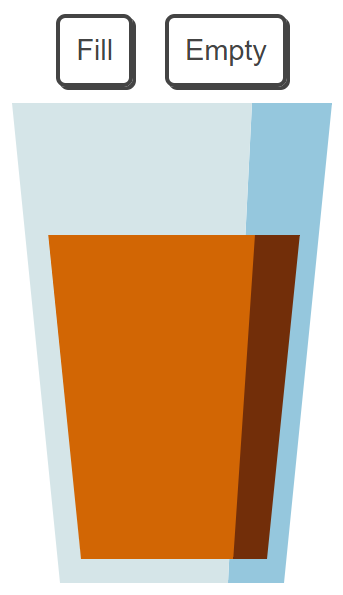
A UI (or more likely part of a UI) can be represented by a state chart. We can start with a simple a slightly modified version of the Glass state chart example from the XState docs. The glass can be filled up in stages or emptied in one go. The glass can’t be overfilled. It looks like this:
Here is the state chart powering the component and it’s visualisation:
 {
    id: "glass",
    context: {
      amount: 0
    },
    initial: "empty",
    states: {
      empty: {
        on: {
          FILL: {
            target: "filling",
            actions: "addWater"
          }
        }
      },
      filling: {
        on: {
          // Transient transition
          "": {
            target: "full",
            cond: "glassIsFull"
          },
          FILL: {
            target: "filling",
            actions: "addWater"
          }
        }
      },
      full: {}
    },
    on: {
      EMPTY: {
        target: "empty",
        actions: "emptyWater"
      }
    }
  }
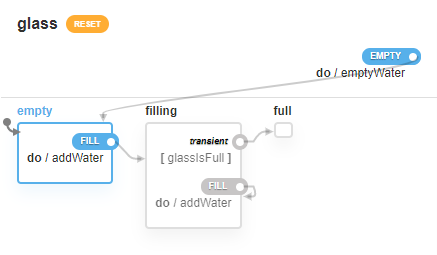
We have three states (empty, filling, full), two events to transition between filling and emptying, guards to stop over filling and the ability to empty at any point.
Graph
It is possible to represent a state chart as a directed graph. Each state being a vertex and each transition being an edge. A very simple graph that can be generated from the Glass state chart would look like this:
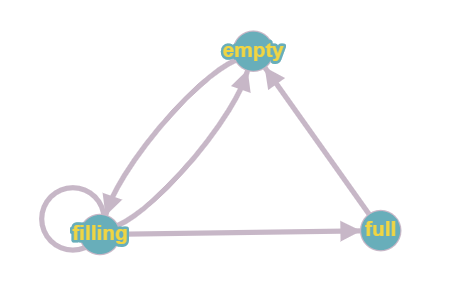
We can move:
- from empty to filling
- from filling to filling
- from filling to full
- from filling to empty
- from full to empty
We can’t move empty to full, or from full to filling
Testing by walking the graph
Walking the graph is the process of moving from vertex to vertex via an edge, or from state to state via events. We want to validate that the component being tested has correctly implemented the behaviour we have defined in our state chart.
The graph tells us what events are required. We can then look up a state and event; and interact with the component based on this lookup. This is where a library like Testing library comes in extremely useful for interactions.
An example of the empty to filling transition for the Glass component could look like this:
const transistion = {
 empty: {
  FILL: (container) => {
   fireEvent.click(getByText(container, 'Fill'));
  }
 }
};
Whenever we transition from empty to filling via a FILL event. The component should find the button that says “Fill” and click it.
To then go through multiple steps along the path we fill out the rest of the transitions and end up calling something like this:
transistion.empty.FILL(container);
transistion.filling.FILL(container);
transistion.filling.FILL(container);
transistion.filling.FILL(container);
transistion.full.EMPTY(container);
The next step is then to validate that the state (and/or context) is correct. Again using Testing library we can check that the component has updated correctly. Rather than testing the internals of the state machine we are testing that the component is expressing the behaviour we expect.
expect(queryByTitle(container, 'The glass is about a quarter full')).toBeTruthy();
Common paths
Quite quickly paths become common. With the glass component getting to the point where the glass is full and then testing from there.
function fillTheGlass(container) {
 transistion.empty.FILL(container);
 transistion.filling.FILL(container);
 transistion.filling.FILL(container);
 transistion.filling.FILL(container);
}
Having something like this in place makes refactoring easier as it reduces duplication, keeps consistency between tests as the same path is travelled and helps keep you working on the outside of the component and keeping you away from the implementation details.
I also find it is a good tool for finding and deleting redundant tests, a way of highlighting over testing. Where a path has been walked multiple times that could show potentially redundant tests, the important part is making sure that the each step is correctly validated.
In action
Below is an example code sandbox to see what I have written in action.
Observations
One of the things I realised while working this way is that we are in fact creating a pseudo-state chart in the transitions look up. In fact although XState powers the component, a component does not require it to be powered by a state chart for it to be tested this way. The combination of a component and test both sharing the same underlying logic is very powerful. This does open the door to allowing existing code and components to be tested this way. By modelling the desired behaviour and then basing the tests on that.
These test feel a lot like the behaviour style tests from Cucumber and “Given When Then”. Where rather than mapping “natural” language to ways of interacting and validating a system under test; The statechart and visualisation is used to map the interactions to the behaviour.
Graph walking is at the heart of automated model-based testing. By using graph walking algorithms you can generate tests automatically based on the results.
Techniques like this help to move away from the how your application works to what it does. The goal is to make sure our application does what we want it to do.